← MZORK_LAB
METRONA.exe COUNTING

MZORK LAB // OPEN SOURCE

METRONA

Web analytics from your server logs

Pageviews, visitors, top pages, referrers and daily trends for every site you run — counted from the access logs your server already keeps. No tracking script, no cookie banner, no third party watching your visitors.

  • input nginx or Caddy access logs
  • output YAML per site + a web dashboard
  • on your pages nothing — no script, no cookies
  • stack Node.js, hourly job, no database
  • license MIT, open source
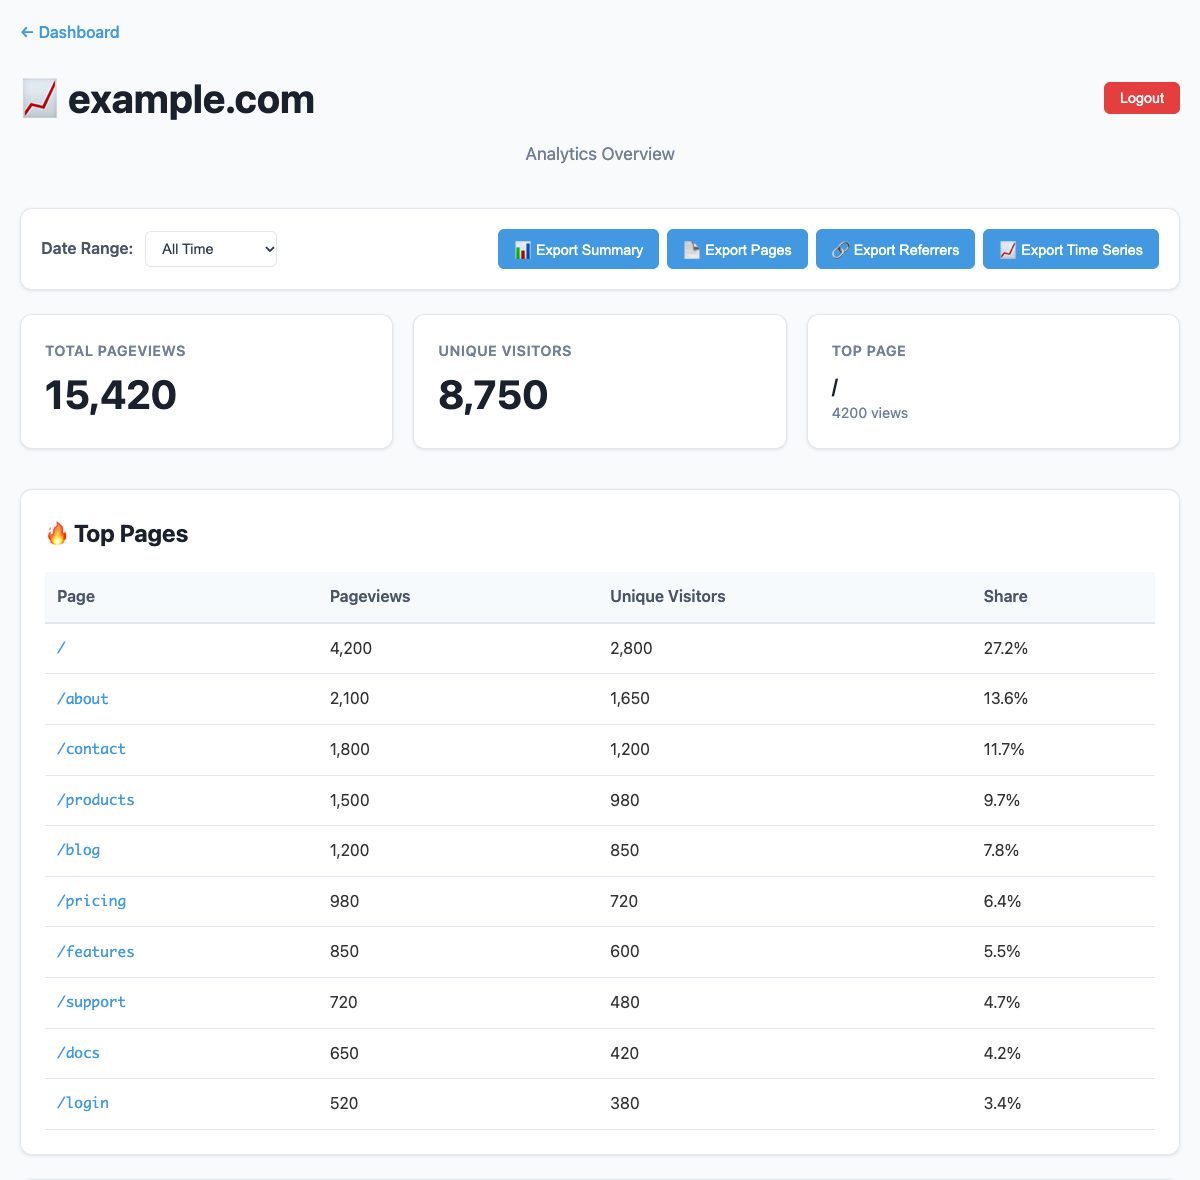
metrona.example.com — example.com
Metrona's dashboard for one site: total pageviews, unique visitors, top page, and a table of top pages

HOW_IT_COUNTS

Three steps, once an hour, entirely on your server.

01

READ

Every page request already lands in your web server’s access log. Metrona reads that log once an hour — no tag to paste, nothing for an ad blocker to block.

02

FILTER

Crawlers, uptime checks, scripts, images and stylesheets, errors and single-page-app background requests are dropped. What is left is people reading pages.

03

COUNT

Visitors become a salted one-way hash: countable, never identifiable. Totals, top pages, referrers and day-by-day trends go into plain files and a small dashboard.

TRY_IT.sh

$git clone https://github.com/teamzork/metrona.git

$cd metrona && npm install

$node examples/try-dashboard.js # sample data → localhost:3003

A minute on your laptop with sample data. For a real server — config, two systemd services, the dashboard behind HTTPS — follow the setup guide.

FIELD_NOTES

Where it already runs.

Metrona counts production sites behind Caddy, and dimka.com behind nginx and Cloudflare, where it feeds a traffic tab in our own ops console. It started as an experiment in getting honest numbers without putting anything on the page — and stayed.